Generational Differences in Sporting Event Resident Sentiment
Share This Post
Keen Observations on a Timely Topic
It turns out that a lot of people want to know about resident sentiment towards sporting events. (As we suspected, this would happen!)
Since we launched our “Scoring Goals for the Community” report with Longwoods International, we’ve heard from several astute readers about an interesting finding in the report related to generational differences in the perception of sporting events as a community asset.
Well done, young grasshoppers! You’re starting to think about the “so what?” of this data and what it means for the industry down the line, or “longitudinally,” as us research-nerds like to call it.
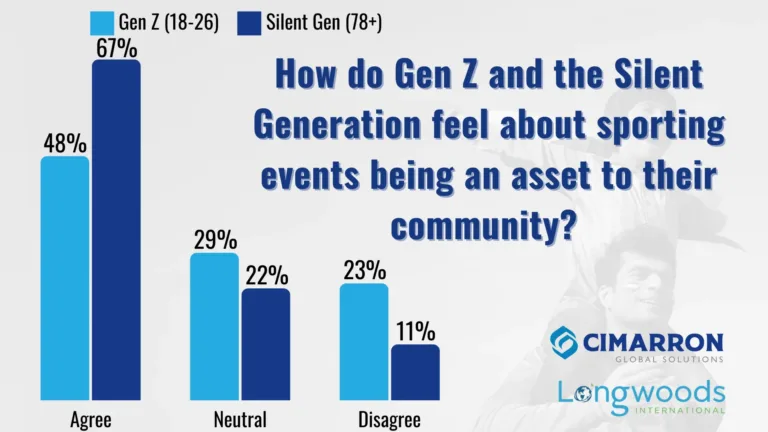
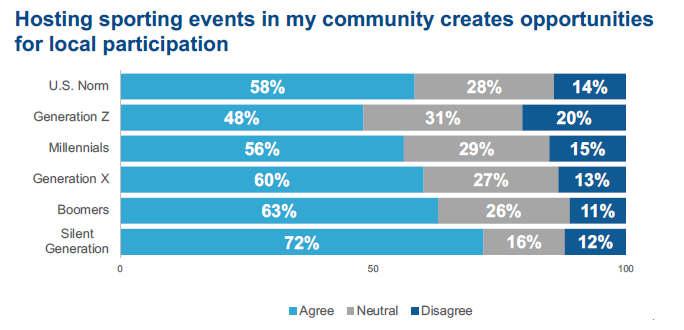
If you backed away from the bar graphs in the report (Charts J, K, L, M, & N; report pages 9 & 10), you noticed that every chart showed a decreasing level of agreement with the statements provided the younger the respondents. In some cases, the swings between the percent of agreement among Gen Z respondents (ages 18-26) and Boomers (59-77) were 12+ points and between Gen Z and the Silent Generation (78+) were 20+ points.
Simply stated, anecdotal evidence from the study shows increasingly less support among the younger generations for several factors of resident sentiment including sporting events held in the respondents’ local area as community assets, that they provide exposure to the community, that they improve health and wellness in the community, that they create opportunities for local participation, and support for hosting college and professional sporting events in the community.
Is your head spinning yet? Mine is!
Questions You Should Be Asking
Here are the two most important questions to ask as you reflect on this data:
- Why is this happening?
- Should the industry be concerned?
Let me take a few words to dive into the details.
Holistically, no. I do not believe there is cause to sound the alarm at this point for several reasons.
- They just aren’t there yet. Gen Z-ers are 18-26 years old, and Millennials are 27-42 years old. Many in Gen Z have likely not entered the life phase of having kids participating in sporting events, though some might participate themselves. There is a good likelihood that they are either still in college or early enough in their careers that they may not be as ingrained in the perceived “good” sporting events have in their communities. It could be a general lack of knowledge and awareness.
- The tourism mirror. This same trend also occurs across Longwoods’ National Resident Sentiment of Tourism study. We see that support for tourism growth increases with each generation. Support begins at 51% for Gen Z and increases to 68% for Boomers. Similarly, perceptions that tourism is good for their state follow the same trend, with sentiments increasing with each generation (Gen Z: 45%; Millennials: 61%; Gen Z: 70%; Boomers: 74%).
- The grey matter. If you look at the charts noted above, the focus is easily on the light blue (“Agree”) and the dark blue (“Disagree”). But the real opportunity is in the grey…those that are neutral towards the statement. Respondents who disagree may never fully jump over to the light blue and indicate agreement, but those in the grey stand to be convinced. We want to see respondents in grey become respondents in light blue as they age.
- Lastly, strength in YOY. The year-over-year (YOY) growth is still showing positive increases across the board, averaging nearly +10 points, compensating for generational differences to this point. Does this mean those increases result from those who responded “disagree” to have jumped ships to “agree”? Not necessarily, they could be “neutral” now and some “neutrals” could have moved to “agree”. As time passes, people’s perceptions shift.
Let Prudence Prevail
Hear me when I say, I do, however, believe it is prudent to keep an eye on these data points.
And we are committed to doing just that for you.
There are several trigger points and layers of additional data we are evaluating in addition to those within the report for added context and clarity.
For example…
- IF we start to see declining resident sentiment among certain indicators in the study, our ears will perk up.
- IF we notice generations are not increasing their overall agreement with these indicators as they age, we’ll take studious note.
- IF we see consumer behavior shifts – such as participation and buying power trends – that will, in turn, impact resident sentiment of sporting events, we will keep the industry informed.
The fact is, the landscape of sporting events (and thus, the sport & tourism industry) is changing. We’ve written about it in several pieces, and resident sentiment of these sporting events is a key indicator of changes that may be on the horizon.

19th Hole With Stoll
Think of the sport and tourism industry like a car.
You don’t judge the overall maintenance of your car solely by how much gas is in the tank. Rather, you look at mileage, tire pressure and wear, oil life, alignment, batteries, and many more factors to gauge your safety on the road.
Similarly, we don’t judge the health and sustainability of our industry just based on economic impact and hotel room nights. We look at many more factors, such as resident sentiment—and the layers of information that contribute to these factors—to assess and optimize the success of the sport and tourism industry.
That’s our passion and our purpose. Plain and simple. So, you get busy doing your thing, and we’re committed to providing the data and insights to help you do your job.
Evoke a thought.
